例子3 结果可视化
作者:
编辑:
莫烦
2016-11-03
学习资料:
matplotlib 可视化 
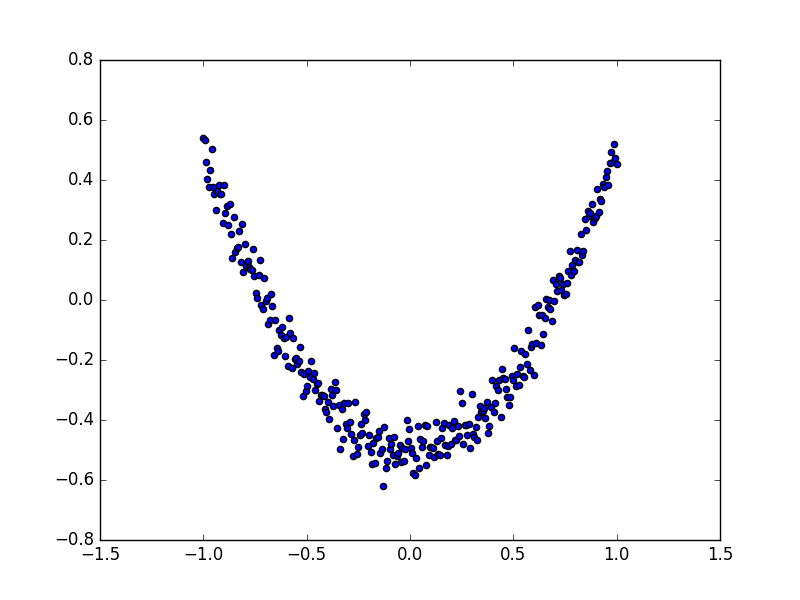
构建图形,用散点图描述真实数据之间的关系。
(注意:plt.ion()用于连续显示。)
# plot the real data
fig = plt.figure()
ax = fig.add_subplot(1,1,1)
ax.scatter(x_data, y_data)
plt.ion()#本次运行请注释,全局运行不要注释
plt.show()
散点图的结果为:
接下来,我们来显示预测数据。
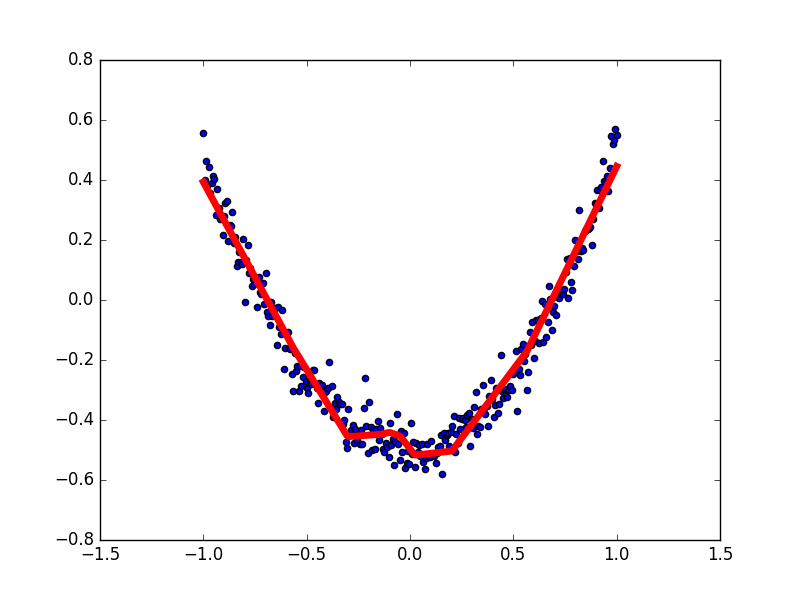
每隔50次训练刷新一次图形,用红色、宽度为5的线来显示我们的预测数据和输入之间的关系,并暂停0.1s。
for i in range(1000):
    # training
    sess.run(train_step, feed_dict={xs: x_data, ys: y_data})
    if i % 50 == 0:
        # to visualize the result and improvement
        try:
            ax.lines.remove(lines[0])
        except Exception:
            pass
        prediction_value = sess.run(prediction, feed_dict={xs: x_data})
        # plot the prediction
        lines = ax.plot(x_data, prediction_value, 'r-', lw=5)
        plt.pause(0.1)
最后,机器学习的结果为:
分享到:
![]()
![]()
![]()
![]()
如果你觉得这篇文章或视频对你的学习很有帮助, 请你也分享它, 让它能再次帮助到更多的需要学习的人.
莫烦没有正式的经济来源, 如果你也想支持 莫烦Python 并看到更好的教学内容, 赞助他一点点, 作为鼓励他继续开源的动力.

